
 Market Insight - February 2019
If you ever doubted the influence that central banks, particularly the U.S. Federal Reserve, have over financial markets, let the past two months put any debate to rest. On December 19th, the Federal Reserve announced that it would raise short-term interest rates for the ninth time since 2015. The announcement was generally not a surprise, but it came at a time when the stock market was falling in response to weakening economic growth expectations. The news fueled concerns that the Federal Reserve may be tightening financial conditions too quickly. The S&P 500 Index (an index of U.S. stocks) lost 7.6 percent1 in the days following the Federal Reserve’s announcement.
Just three weeks later, on January 10th, the Federal Reserve clarified its plans and conveyed that further increases to short-term interest rates would only come if the economy was healthy enough to handle it. Essentially, this comment told the market that the Federal Reserve did not intend on pushing interest rates higher despite turmoil in the stock market. Following the clarifying comments on the 10th, the S&P 500 Index had increased by 4.6 percent by the end of January1.
Risks of Raising Interest Rates Too Quickly
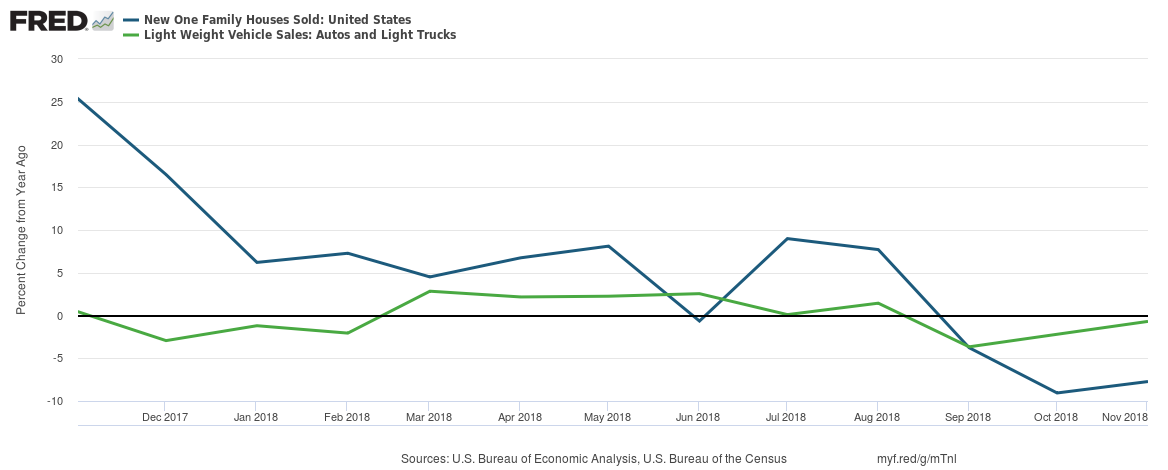
The capital markets have been addicted to low interest rates and stimulus in general. The Federal Reserve has been slowly weening us off of low interest rates, but the journey has been a rocky one. As rates continued higher - the Federal Reserve has increased short-term interest rates from 1.5 percent to 2.5 percent in the past year - the market seemed to take it in stride until late in the year. Raising interest rates too quickly is widely considered to have contributed to the cause of several past economic recessions. Higher rates make borrowing money more expensive, which eats into the profits of companies and it decreases consumer spending on larger ticket purchases. Chart 1 shows that sales of new homes and automobiles decreased in 2018 as interest rates moved higher.
Chart 1
Yield Curve Heading Toward Inversion?
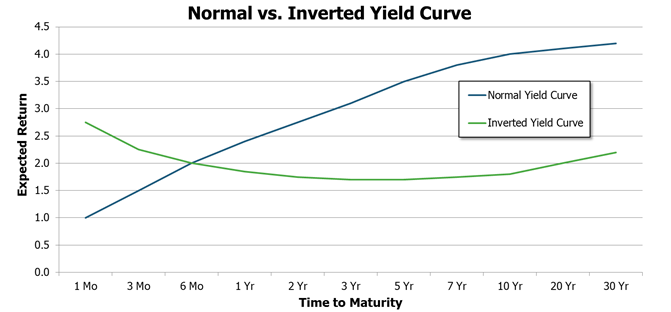
An indicator that has been widely regarded as a bellwether for economic recessions is an inverted yield curve. The yield curve is a line chart that depicts the expected return of bonds with varying years or months until they mature. In general, you would expect a higher return from a bond that matures in ten years than you would from one that matures in one year. You’re agreeing to lend money for ten years versus just one year. Consequently you should be rewarded for the longer lending period. So when we plot out the expected return of bonds maturing at different times, we should normally see an upward sloping line from shorter-term bonds to longer-term bonds. An inverted curve means that this line slopes downward instead.
Chart 2
The yield curve is complicated and not as easily understandable as the media may portray it to be. Instead of going into the intricacies of the yield curve, we can simply state that an inverted curve is generally understood to mean that bond investors believe that interest rates will be lower in the future than they are today. This would be a situation that may coincide with an economic recession. As can be seen in Chart 3, recessions (shaded areas) have been preceded by periods when 10-year U.S. Treasury bonds had lower expected returns than 1-year Treasury bonds (depicted when the blue line dips below the black axis line). Also note in Chart 3 that the blue line has yet to cross the black axis line during the current economic expansion.
Chart 3
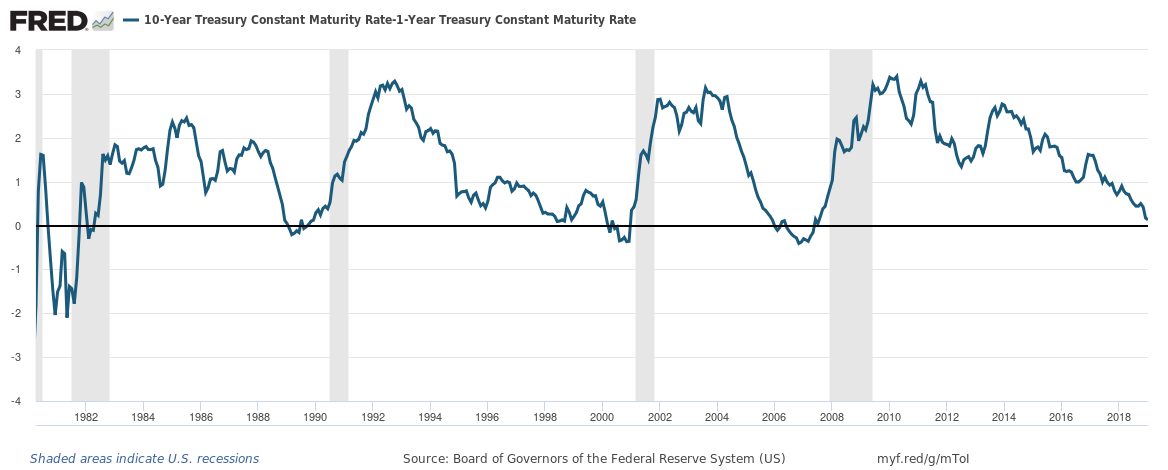
Prior to each of the past seven U.S. economic recessions the yield curve did indeed invert. The span of time from the initial yield curve inversion to the beginning of the recession has varied significantly. The time span has ranged from seven months to nineteen months, a range of one year. So while this has been a reliable indicator of turmoil ahead, it does less to inform on the timing of the coming recession. For investors, timing can be everything as we have witnessed over the past two months of market volatility. As an example, the yield curve initially inverted in late-2005, prior to the last recession. From the point of inversion to the peak of the S&P 500 Index in late-2007, the stock index gained a cumulative 22 percent2. The recession began in 2008.
Conclusion
No matter how “fail-proof” an indicator or set of indicators may seem to be, every situation is different. Indicators can lose their effectiveness, they may give false readings, or they may be misleading on timing. We choose to set guidelines on the level of exposure you have to the stock market based on our conversations with you and your financial goals. At times we make relatively modest adjustments to that exposure based on a “weight of the evidence” approach. Currently, the weight of the evidence is trending toward a more defensive position. Much of this is due to a high level of policy uncertainty in the months ahead. The ongoing trade war with China, the impending separation of the United Kingdom from the European Union and monetary policy uncertainty in the U.S. and abroad create the potential for many different paths that the capital markets may take this year. Uncertainty is common in investing, but the aforementioned issues are leading to a heightened level in 2019.
We continue to believe that investing in stocks represents the best opportunity to grow your wealth over time. This conviction along with our respect for the unpredictability of the stock market in the short-term sets the foundation for our investment philosophy. Therefore, a defensive posture may manifest in our decision to build up more cash in your portfolio if you expect to need to draw from your portfolio in the near-future. We may also transition your bond investments toward higher-quality bonds or shift some of your more growth-oriented stocks to areas of the stock market that tend to hold up better in a downturn. What we do not do is attempt to time the market by dramatically reducing your exposure to stocks.
Given the level of uncertainty in the next few months, we expect that the weight of the evidence may change during that period. Positive developments on trade with China could be very good for the stock market. A messy break-up between the U.K. and the European Union may lead to a recession in the U.K. and broader Europe. Of course, as noted at the beginning of this letter, the influence of central banks cannot be discounted.
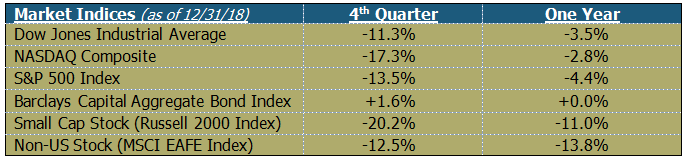
Table 1
Many of you may already know or perhaps have already met the newest addition to our Birchwood family. In October, Rachel Infante joined Birchwood as a Financial Advisor. In a few short months, she has fit right in and has proven to be a fantastic find for us and ultimately for all of you. We are very excited to have her on board and hope you get the opportunity to meet her at our upcoming Open House on February 28th.
Gratefully yours,
Steve Dixon, CFA®
Investment Manager
Kay Kramer, CFP®, Dana Brewer, CFP®, Bridget Handke, CFP®, Damian Winther, CFP®, Rachel Infante, CFP®, Stacey Nelson, CFP®
1 Source: Morningstar. Percentage change calculated by Birchwood Financial Partners using closing values for the S&P 500 Index®. The -7.5 percent was calculated from December 18, 2018 to December 24, 2018. The +4.6 percent was calculated from January 9, 2019 to January 31, 2019.
2 Source: Board of Governors of the Federal Reserve System, Morningstar, Birchwood Financial Partners. Return represents the cumulative total return of the S&P 500 Index® from December 27, 2005 until October 9, 2007. Based on historical yield data from the Board of Governors of the Federal Reserve System, prior to the 2008 U.S. economic recession the yield on the 10-Year Treasury Constant Maturity series was lower than the yield on the 1-Year Treasury Constant Maturity series for the first time on December 27, 2005. Based on data from Morningstar, the S&P 500 Index® peaked prior to the 2008 U.S. economic recession on October 9, 2007.
Chart 1 Source: U.S. Bureau of Economic Analysis, U.S. Bureau of the Census, Federal Reserve Bank of St. Louis. Data is as of November, 2018.
Chart 2 Source: Values are hypothetical and do not represent actual data.
Chart 3 Source: Board of Governors of the Federal Reserve System, Federal Reserve Bank of St. Louis. Data is as of December, 2018.
Table 1 Source: Morningstar. Market indexes are unmanaged and investors cannot invest directly in indexes. However, these indexes are accurate reflections of the performance of the individual asset classes shown. All returns reflect past performance and should not be considered indicative of future results.